I wrote a simple web based monitoring tool with a CGI Script and used HTMX for the statistics to refresh automatically.
When looking for an admin interface to use, I noticed that every single one I was able to find, had way too much stuff going on for my use case (too many features i would never use), or they are not FOSS, which I didn't want for my server. This is when I decided that it would make sense to build my own!
So I started researching on how I could get some system statistics and a shell on a website. Then I discovered CGI scripts (Common Gateway Interface): A way to write shell commands inside HTML tags and then let it display with a webserver. This is quite an old technique, introduced, as of my research in the early 1990s, but still enough for my usecase.
The information I found on the use of CGI scripts was mainly focused on the Apache2 webserver, so I had to find a way to use them with Nginx. This took some more research and tinkering but I eventually got it working after some difficulties.
To get it working, I used fastcgi (in debian the package is called "fcgiwrap ") and some changes in my Nginx configuration (/etc/nginx/sites-available/default):
server {
  listen PORT;
  server_name NAME;

  root /var/www/html;
  index index.html;

  location /cgi-bin/ {
      alias /usr/lib/cgi-bin/;                # Default path for CGI scripts
      fastcgi_pass unix:/var/run/fcgiwrap.socket;
      include fastcgi_params;
      fastcgi_param SCRIPT_FILENAME /usr/lib$fastcgi_script_name;
  }
}
Particularly I had to add the lines in the "location" block.
Then I had to write the CGI script itself. This is what I wrote:
#!/bin/sh
echo "Content-Type: text/html"
echo ""
echo ""
echo ""
echo ""
echo " "
echo " BOP Admin Panel"
echo " "
echo " "
echo " body { font-family: Arial, sans-serif; color: #ffffff; background-color: #000000; }"
echo " .section { margin-bottom: 20px; }"
echo " .section h2 { margin: 0; }"
echo " pre { color: #ffffff; font-size: 14px; white-space: pre-wrap; }"
echo " "
echo ""
echo ""
# CPU Temperature
echo ""
echo "CPU Temperature:"
if command -v sensors >/dev/null 2>&1; then
echo "$(sensors | grep Core | awk '{print $1, $2, $3}')"
else
echo "Command 'sensors' not available."
fi
echo ""
# CPU Usage
echo ""
echo "CPU Usage:"
echo ""
(
# First measurement
awk '/^cpu[0-9]+/ {print $1, $2+$3+$4+$5+$6, $5}' /proc/stat > /tmp/stat1
sleep 1
# Second measurement
awk '/^cpu[0-9]+/ {print $1, $2+$3+$4+$5+$6, $5}' /proc/stat > /tmp/stat2
# Calculation & Output
awk '
NR==FNR {
idle_before[$1]=$3
total_before[$1]=$2
next
}
/^cpu[0-9]+/ {
idle[$1]=$3
total[$1]=$2
if (length(idle_before[$1])) {
idle_diff = idle[$1] - idle_before[$1]
total_diff = total[$1] - total_before[$1]
usage = (total_diff > 0) ? (100 * (1 - (idle_diff / total_diff))) : 0
core = substr($1, 4)
printf "Core %d: %.1f%%\n", core, usage
}
}' /tmp/stat1 /tmp/stat2
)
echo ""
echo ""
# RAM Usage
echo ""
echo "RAM Usage:"
echo ""
echo "$(awk '/MemTotal/ {total=$2} /MemAvailable/ {available=$2} END {usage=((total-available)/total)*100; printf "Percent: %.2f%%\n", usage}' /proc/meminfo)"
echo "$(awk '/MemTotal/ {total=$2} /MemAvailable/ {available=$2} END {printf "MiB: %d / %d MiB\n", (total-available)/1024, total/1024}' /proc/meminfo)"
echo ""
echo ""
# Uptime
echo ""
echo "Uptime:"
echo "$(uptime -p | sed 's/up //')"
echo ""
echo ""
# Removing temporary files
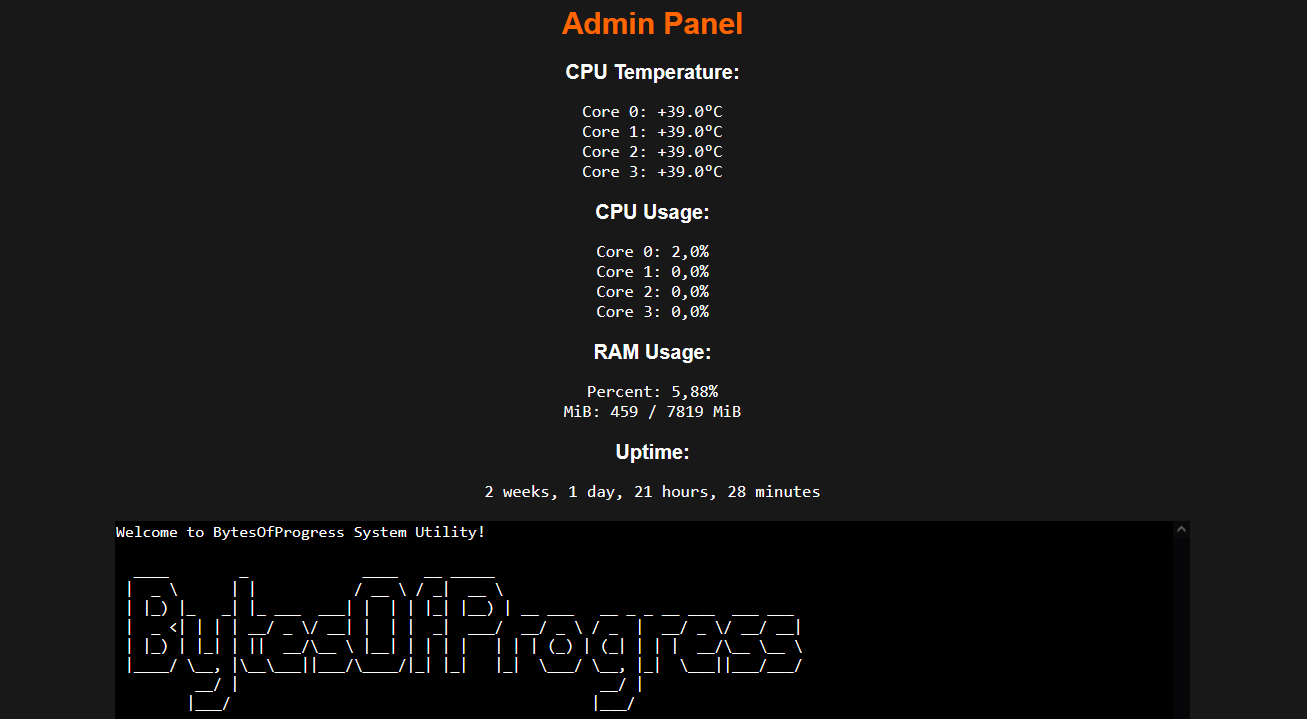
rm /tmp/stat1 /tmp/stat2It displays the CPU Temperature, CPU Usage, RAM Usage in MiB and percentage and the uptime.
I them edited my index.html: I inserted HTMX into it, so that the
statistics get refreshed once a second.
This creates a div and swaps its content to the content of the CGI-script every one second via HTMX.
Info on CSS, title, etc: I figured out, to change the title, favicon and CSS of your index.html, you might have to change it in the CGI-script instead of your HTML style tag or external stylesheet if you plan on doing something similar.
To have shell access in my small "admin panel", I installed ShellInABox and created an iframe that contains it into my HTML. This is what it looks like in the end:
23rd August 2024 | 09:15 AM
I did not really like the look of the admin panel, so I changed it: I let the statistics display next to each other and put them into boxes with borders, so that they can be differentiated from each other much easier.
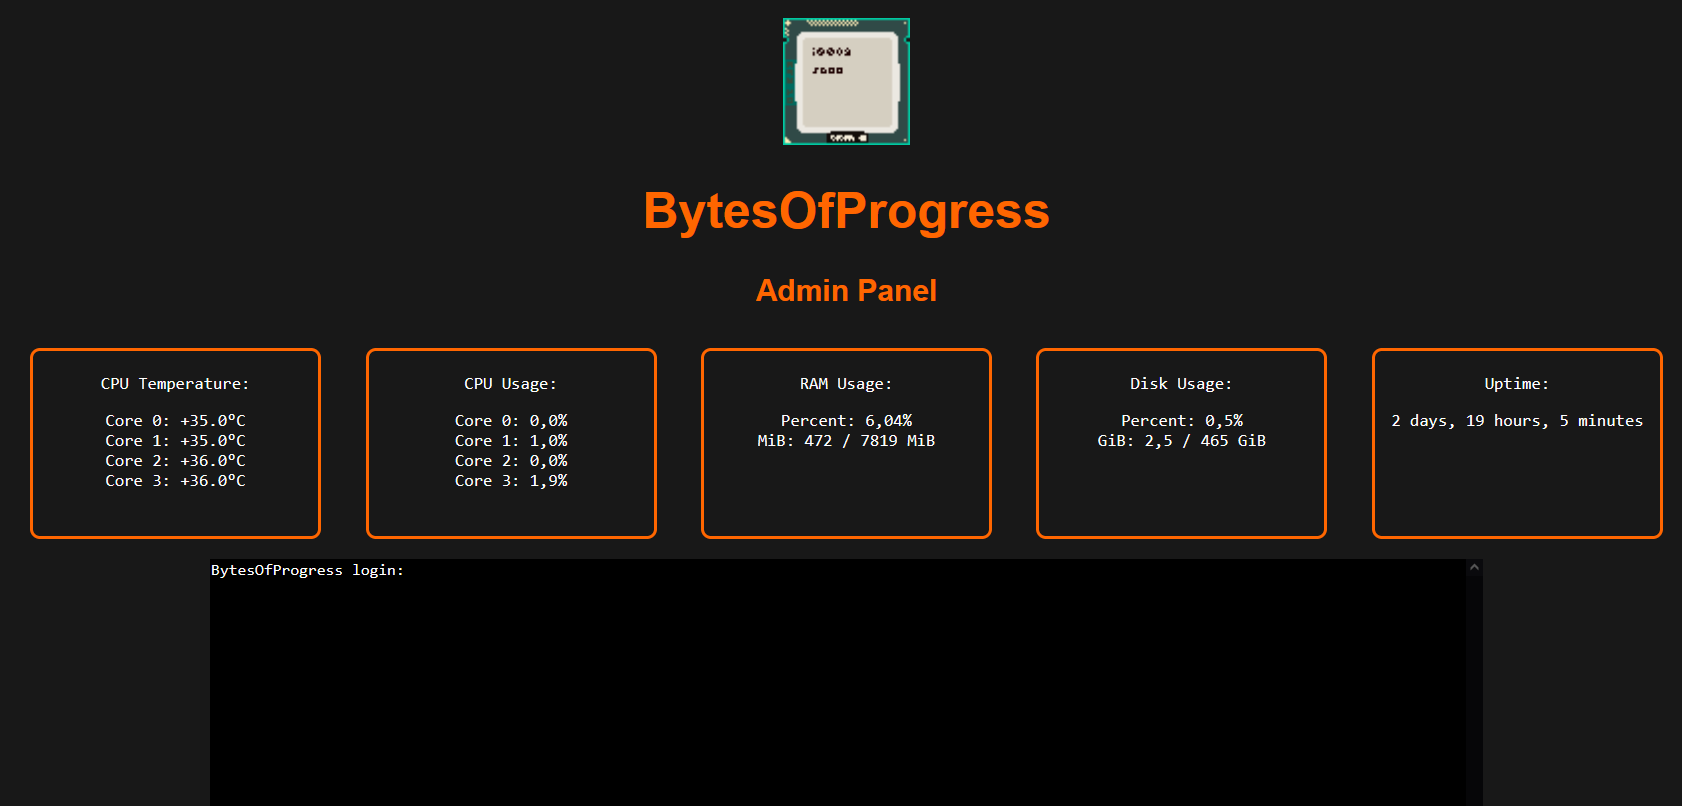
I also added the disk usage to the statistics. I also planned on adding disk I/O and netin / netout statistics, but I did not figure out how to grab that info in a proper way yet.